17 July 2018 | Updated on 17 July 2018
Burn down charts: keeping your eyes on the prize
In any sort of project, we always want to know what our progress is looking like – how far we’ve come, where we’re heading, when we’ll be finished etc. But, arguably, although it’s good to know what w...
In any sort of project, we always want to know what our progress is looking like – how far we’ve come, where we’re heading, when we’ll be finished etc. But, arguably, although it’s good to know what we’ve achieved so far, the most important thing to look at is what is left to do.
Within agile methodologies, the preferred way of displaying this information is through the use of burn down charts (found in AXELOS’ official PRINCE2 Agile® guidance). These are used to illustrate the work that remains in a project in relation to the ‘ideal’ rate of progress. In the image below, the black line represents this ‘ideal’ rate, and the blue line represents the work that has been completed so far.
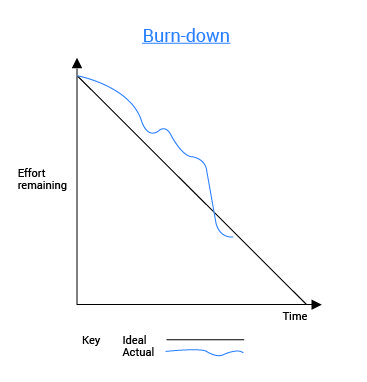
The blue line is updated on a regular basis and, when you compare where both lines end, you can see how much work remains to reach the initial goals set out. With a burn down chart, you can also see whether your work is ahead or behind schedule by observing whether the blue line goes above or below the black line; the former showing that work is ahead of schedule, and the latter showing that it is behind.
Burn down charts support the kind of decision making that is at the heart of any agile approach, as they provide a way to assess scope vs. time. Fine-tuning the content of a sprint to exclude ‘nice-to-haves’ may be the right thing to do, if maintaining cadence is the prime objective.
A burn down empowers the team to make the right choices by showing two vital pieces of information in relation to the project’s end goals: what the actual situation is, and what the final outcome will be at the current rate of progress. As long as the project and its team remain stable, you can predict whether or not you are likely to meet the project’s initial deadline.
Burn down charts provide a visual cue as to the “time” cost of certain deliverables, and that can create a sense of urgency that empowers smart teams and supports a focus on the prioritisation of remaining work.
So, how do these charts work in practice? If you’re new to managing projects in an agile environment, our PRINCE2 Agile® courses will teach you how to apply models and techniques such as burn down charts to your projects — allowing you to benefit from the flexibility of agile, but within the controlled environment of the PRINCE2® methodology.
Find out more about our PRINCE2 Agile courses here.